If you swim, paddle or fish on an English river, you have probably done this: checked the overflow map the night before a trip, spotted a marker a mile upstream of your put-in, and wondered whether to bother. The latest storm overflow data — the annual returns from water companies, plus the near-real-time feeds behind those maps — is meant to settle that question. It helps. But only if you know what the numbers actually describe.
What the new data covers
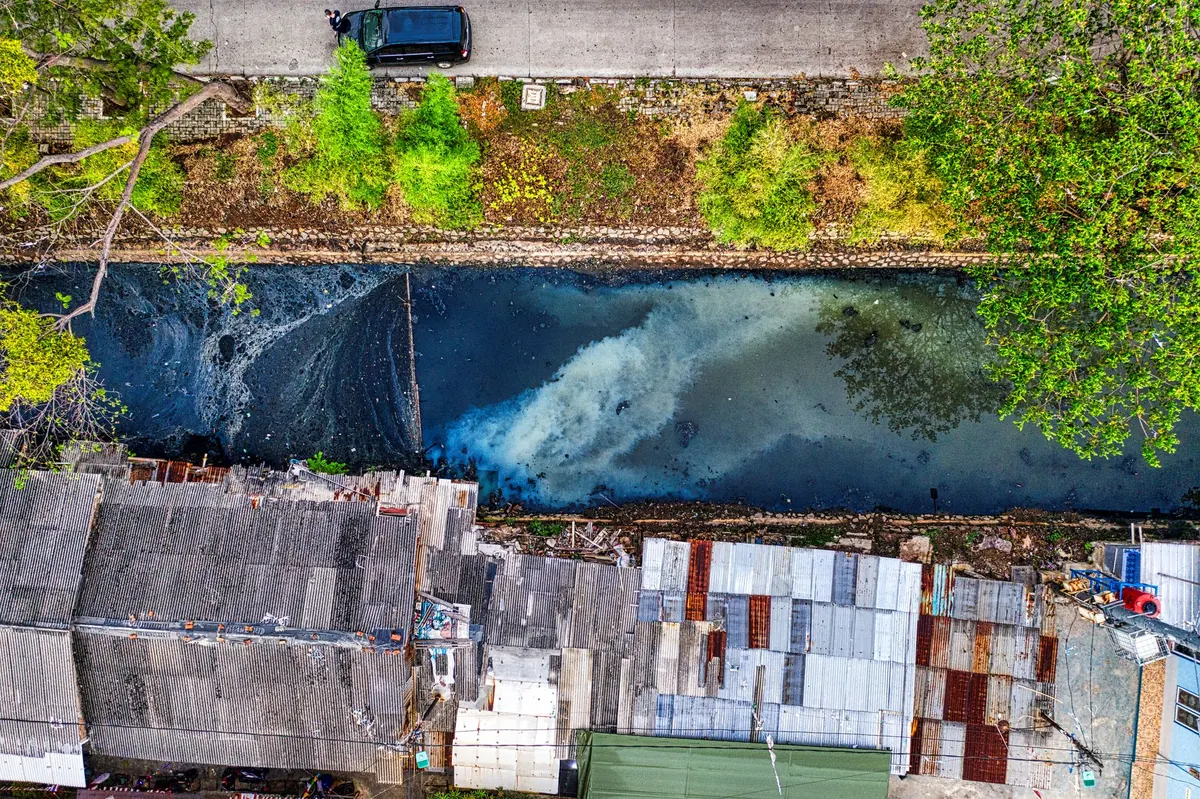
Storm overflows, often called combined sewer overflows or CSOs, are the pipes that release excess sewage and rainwater into rivers when the sewer network is overwhelmed. They were designed as a safety valve for a system that also carries foul water. When they operate, they discharge diluted but untreated sewage.
Water companies are required to monitor them. The Environment Agency collects the results as Event Duration Monitoring data, published annually, while many companies now publish live or near-live spill alerts on their own sites or through third-party maps. So you can see how many times an overflow spilled, roughly how long it spilled for, and in some cases whether it is spilling right now.
Two caveats before you draw conclusions. Coverage is uneven: not every overflow has a working monitor, and the number of monitored assets has grown over the years, which makes year-on-year comparisons misleading. And a wet winter will always produce more spills than a dry one. Weather is part of the story, not an excuse for it, but it does affect the totals.
How to read a spill count
Count and duration are different things
A handful of brief spills in December is a different problem from one overflow running for days on end. Look at total duration, not just the tally. Look, too, at whether discharges were recorded in dry weather. Dry spills come from something other than rainfall — groundwater infiltration, misconnected drains, or a network that simply cannot cope — and they tend to attract the most scrutiny.
What the map will not tell you
- What is in the discharge. Dilution varies enormously with rainfall, and sewage strength is not the same everywhere.
- What happens between the overflow and your spot. Tributaries, other outfalls, farm run-off and road drainage all add to the mix.
- Whether unmonitored overflows are spilling. Absence of evidence is not evidence here.
- Whether the river is clean. “No spill today” describes one pipe, not the water in front of you.
Check your local river in ten minutes
Build this into your routine the way you check the weather.
- Find the overflows upstream of your access point. Your water company’s map shows them; The Rivers Trust’s “Is My River Fit to Swim In?” map pulls much of it together in one place.
- Check recent status. Anything within the last 48 hours should change your plans.
- Cross-check the rain. If there has been heavy rain in the last day or two, assume overflows have operated somewhere upstream, whether or not they appear on a list.
- Work out how far upstream. A spill a few hundred metres above your swim spot matters far more than one ten kilometres up with clean tributaries in between.
- Read the water itself. Discolouration, a sewage smell, grey plumes, foam that does not break up, or sanitary debris are reasons to walk away and report what you see.
- Log it. Note the date, time, location and what you saw. If you suspect a pollution incident, call the Environment Agency’s incident hotline on 0800 80 70 60.
What it means for swimmers, paddlers and anglers
Everyone who gets in the water is exposed to the same thing, but the risk looks different depending on what you do.
Swimmers
Designated river bathing waters are few, though the Wharfe at Ilkley became the first inland river stretch to be designated. Those sites get testing through the season. Weekly sampling tells you about the general condition of a spot; the overflow map tells you about the day. If in doubt after rain, swim elsewhere or wait.
Paddlers
You are in the water by design and you take it on the face, hands and any cuts. Capsizes and rolls increase exposure. Check before you load the boat, avoid eating with wet hands, and take clean water and soap for afterwards.
Anglers
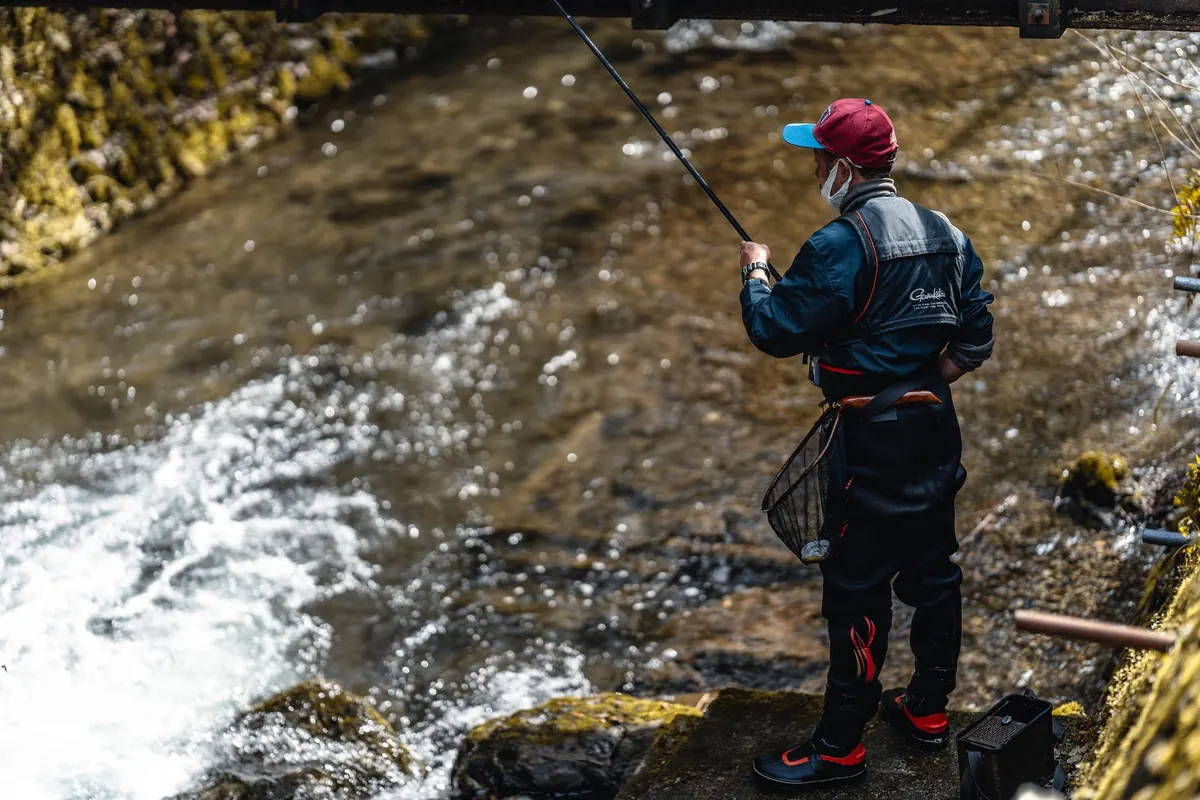
Sewage hits fish before it hits us: ammonia, low dissolved oxygen and silt can do real damage, and sewage fungus on the gravel is a visible warning sign. Keep a note of what you see. Clubs and local groups hold a lot of evidence that gets used in campaigning.
A word on health
Gastroenteritis, and skin and ear infections, are the common outcomes. Leptospirosis, sometimes called Weil’s disease, is rare but serious and is treatable if caught early. Cover cuts, avoid swallowing water, and shower as soon as you can. If you become unwell after being in a river — fever, diarrhoea, flu-like symptoms or jaundice — see a GP and mention where you have been. That is general information rather than medical advice; get proper guidance from a healthcare professional.
What is changing
Pressure has produced movement. National targets for reducing storm overflow discharges now stretch to the middle of the century with interim milestones along the way, monitoring is being extended, and more river stretches are being put forward for bathing water designation. Enforcement has tightened too, with investigations into dry-weather spills. None of it is instant, and rivers recover on their own timescales.
Make the data work for you
Treat the overflow map as one input rather than a verdict. Check it, check the rain, check what you can see — then decide. The best habit is a short one: two minutes the evening before, one look at the river when you arrive, and a note in your phone when something looks wrong.
If you want more than a clean swim, join in. Local river groups, angling clubs and citizen science projects record what monitors miss, and that record is what shifts decisions. The data can tell you about a pipe. Only people on the bank can tell you what the river is actually like.
Photo: megspl / Pixabay